Visualizing the Question Landscape
Knowledge Orchestration includes two visualization surfaces that help you move beyond tabular question review and understand how discovered questions are distributed, grouped, and positioned for answer strategy. These are the Cluster Map and the Compliance Map, accessible from the visualization view by selecting View all in the Cluster landscape panel on the dashboard.
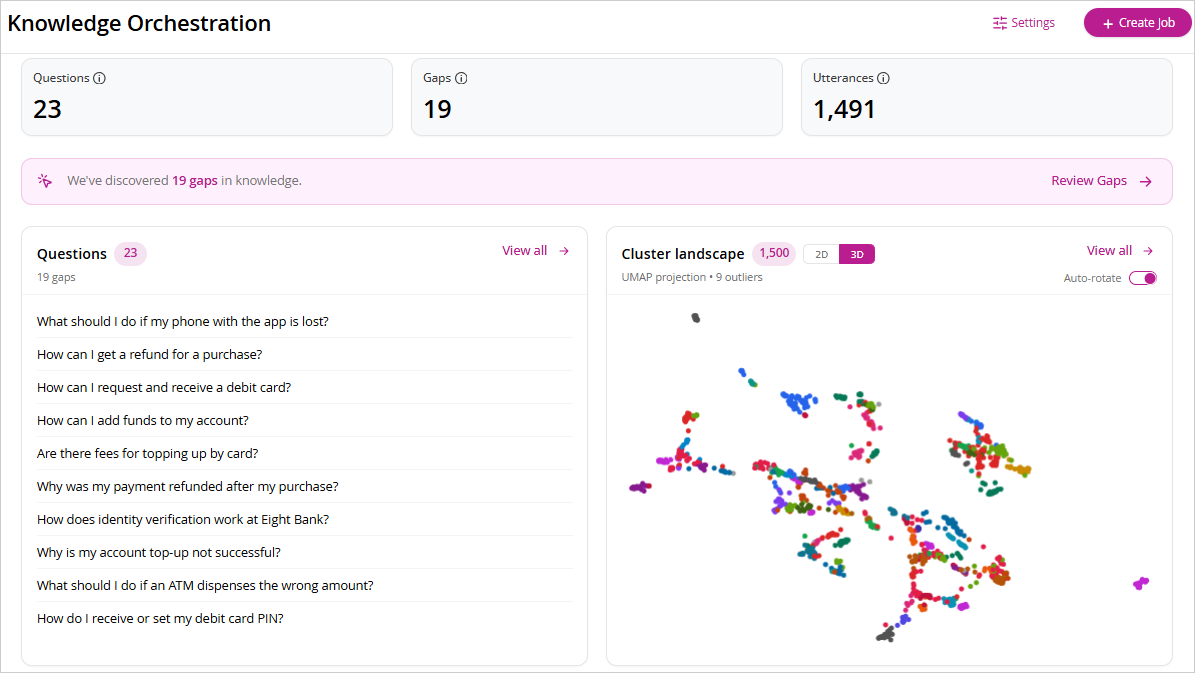
Use the Cluster Map and Compliance Map toggles in the upper right of the visualization view to switch between the two maps.
Cluster Map
The Cluster Map is a visual representation of how utterances and canonical questions are distributed in semantic space after KO processing. It is built from the embeddings and clustering logic used during the job run.
The map helps you understand whether customer demand is concentrated or fragmented, whether clusters appear dense and coherent or scattered and noisy, where outliers exist, and how canonical questions or topics are distributed relative to each other.
What is shown on the map
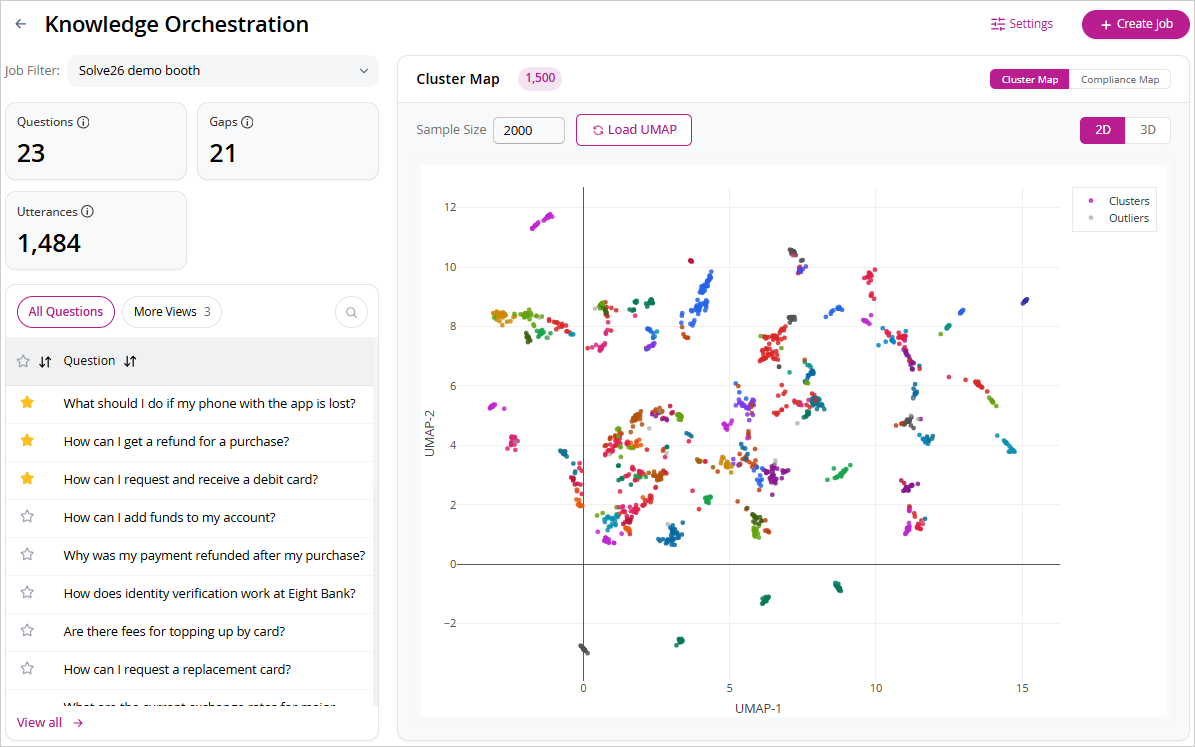
In the default view, each dot represents an utterance and each color represents a distinct canonical question or cluster. Multiple differently phrased utterances that belong to the same canonical question appear in the same color. Dense colored regions indicate stronger semantic consistency within a cluster. Sparse or isolated dots may indicate low-volume or ambiguous utterances.
Hovering over a point displays the cluster it belongs to and the utterance it represents.
Sample size and loading
Because plotting the full utterance population is not always practical, you can set a representative Sample Size before rendering the map. Enter a value in the Sample Size field (maximum value- 2000) and select Load UMAP to render the visualization. This keeps the map performant and prevents visual overload while still giving you a reliable picture of the structural behavior of the question space.
2D and 3D modes
The Cluster Map can be rendered in two modes, selectable from the upper right of the map area:
-
2D — A flat overview suitable for quick structural inspection.
-
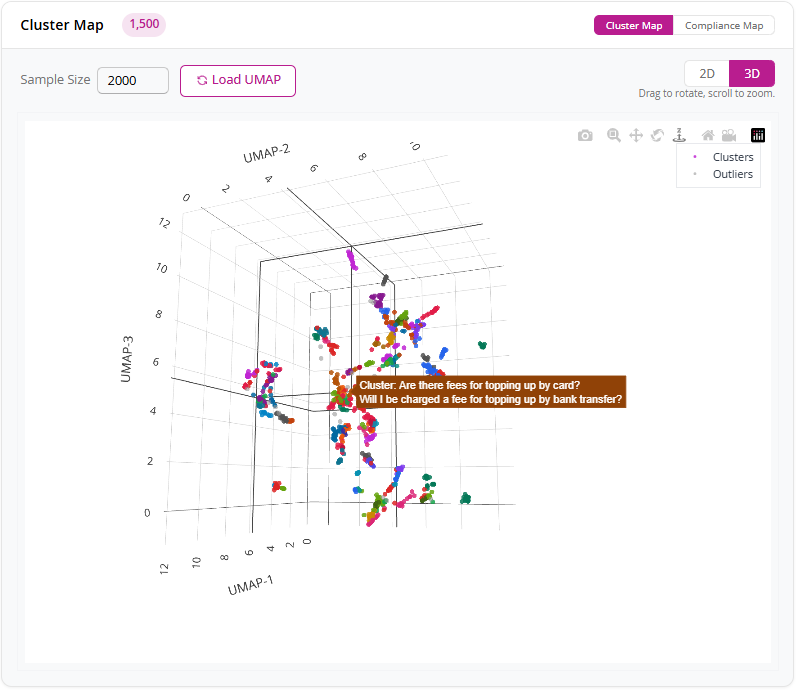
3D — A spatial view that makes cluster separation more visible, particularly where clusters overlap in 2D. In 3D mode, drag to rotate and scroll to zoom. Hovering over a point shows the cluster name and a sample utterance.
Changing the question list view
The left panel displays the question list associated with the current map. By default, it shows All Questions. Questions in the left panel can be starred directly from this view.
Clicking a question, opens the Utterances modal which lists all the utterances for that canonical question along with the source. To view the question details, click the See full question details link.
Select More Views to switch to one of the following:
-
Top 20 — Shows the 20 highest-priority canonical questions, useful for focusing on the strongest demand signals.
-
Star — Shows only starred questions, allowing you to inspect whether your priority items are structurally concentrated or spread across different regions of the semantic space.
-
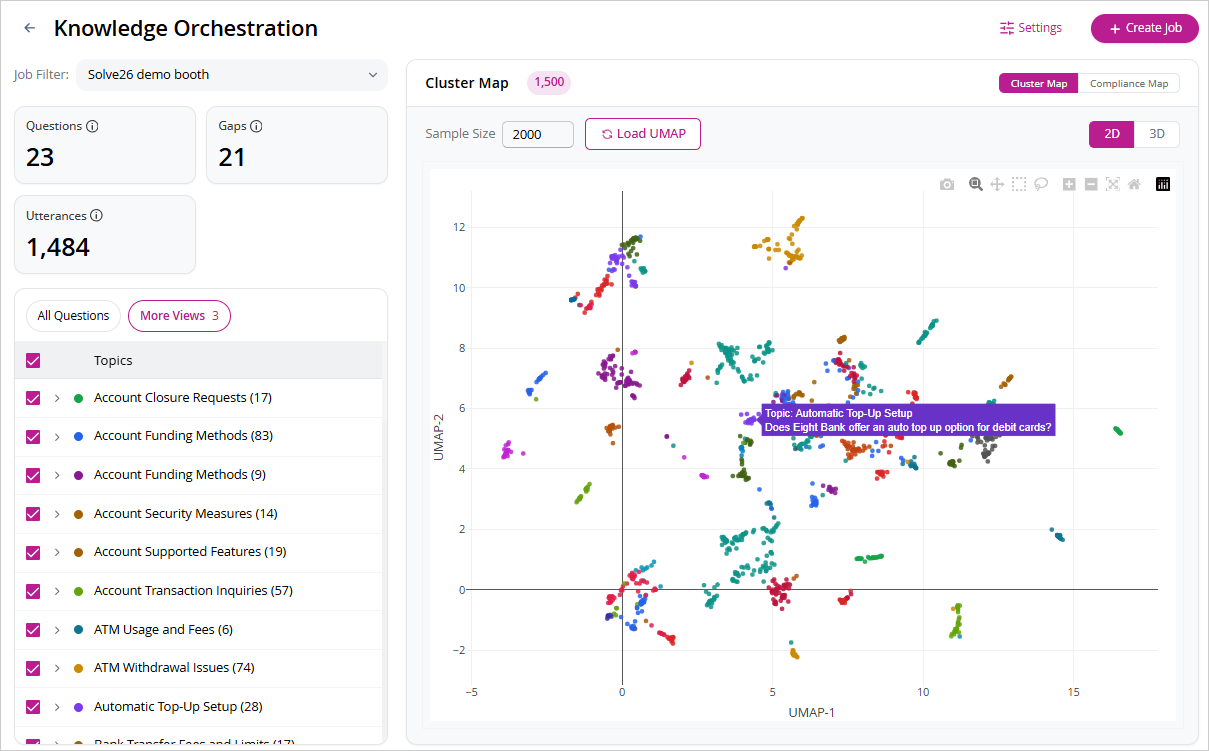
Topic — Switches the map to a topic-based view where each dot represents a canonical question and each color represents a topic. This view helps you assess whether topic boundaries appear natural or forced, and whether certain topics are tightly grouped or semantically diverse.
Outliers
The map legend identifies Outliers as a distinct category. Outliers are points that do not belong strongly to any dense cluster. They may represent rare but legitimate customer questions, weakly formed clusters, or noise in the source data. Outliers are not automatically a problem — they are a signal worth closer inspection.
How to interpret the Cluster Map
The Cluster Map is an interpretive tool, not a decision engine. Use it to develop an understanding of the shape of the discovered question space, the reliability of the clustering result, and whether certain areas of demand may need closer manual validation. It is most useful when paired with the canonical question list, topic structure, ranking outputs, and answer confidence data.
Compliance Map
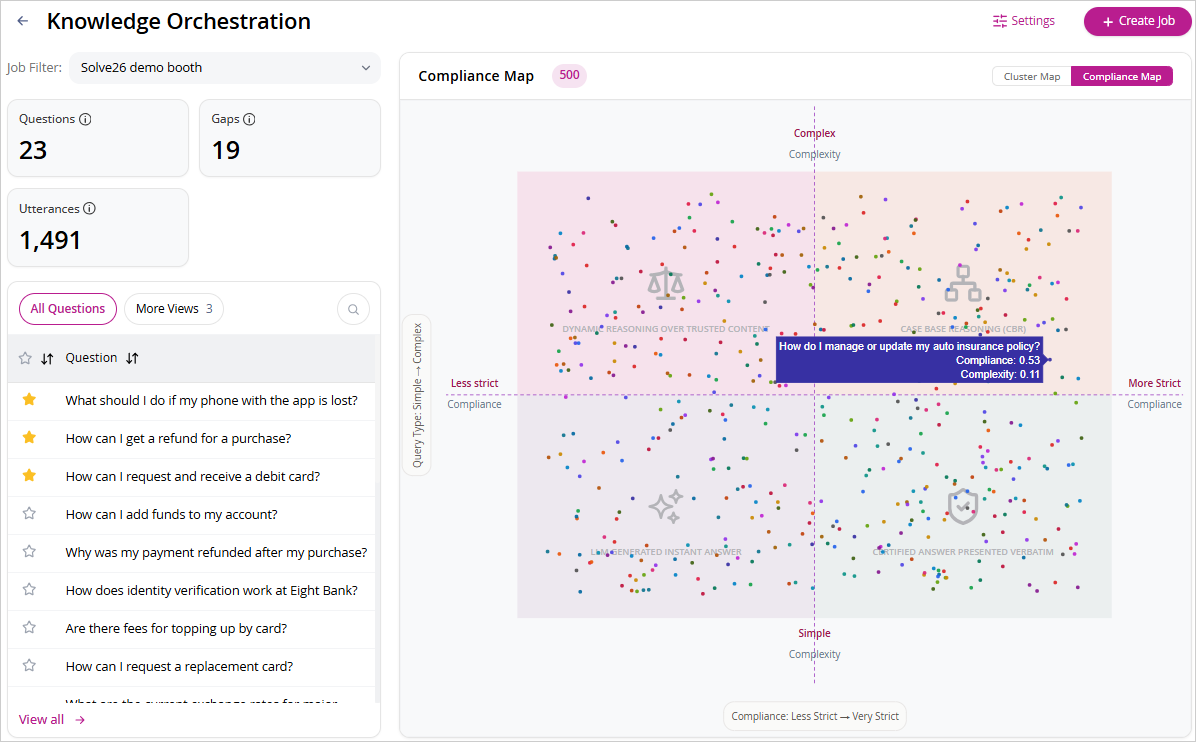
The Compliance Map places canonical questions on a two-axis plot based on their complexity and compliance characteristics. Unlike the Cluster Map, which is semantic and structural, the Compliance Map is operational — it helps you reason about what type of answering strategy may be most appropriate for different questions.
Axes
The map uses two axes:
-
Vertical axis (Complexity) — Questions toward the top of the map are more complex to answer, automate, or document robustly. Questions toward the bottom are more straightforward.
-
Horizontal axis (Compliance) — Questions toward the right of the map are more compliance-sensitive and require tighter answer governance. Questions toward the left carry a lighter compliance burden.
Each dot represents a canonical question. Hovering over a dot shows the question text along with its compliance and complexity scores.
Answer strategy quadrants
The intersection of these two dimensions creates four zones, each suggesting a different answer handling approach:
Lower left — LLM Generated Instant Answer
Questions in this area are relatively simple and carry a lighter compliance burden. They are the most suitable candidates for generated instant answers and lightweight self-service experiences, where the answer path is straightforward and governance requirements are lower.
Upper left — Dynamic Reasoning over Trusted Content
Questions here are not highly compliance-sensitive but are more complex to answer. They benefit from dynamic reasoning over trusted content, multi-step synthesis, or answers that draw from multiple sources. The challenge is answer complexity rather than compliance control.
Upper right — Case Based Reasoning (CBR)
These questions are both complex and compliance-sensitive. They are best handled through case-based reasoning or more governed workflows where answers require higher confidence, stronger provenance, and more controlled resolution paths.
Lower right — Certified Answer Presented Verbatim
Questions in this area are structurally simpler but require strict compliance control. The appropriate approach is direct retrieval and presentation of approved, certified content. The challenge here is preserving answer integrity rather than reasoning difficulty.
Using the question list with the Compliance Map
The left panel works the same way as in the Cluster Map, with All Questions as the default and More Views providing access to Top 20, Star, and Topic filters. This makes the Compliance Map a linked exploration surface — you can select a topic or question from the left panel to understand where it falls in the compliance and complexity space, and whether a topic as a whole tends to cluster within one answer strategy zone or spans multiple quadrants.
How to interpret the Compliance Map
Not all questions fall cleanly into a single quadrant. Some questions sit close to boundaries, and some topics may span multiple answer zones. The Compliance Map should be treated as a directional aid rather than a rules engine. Always review the question itself, its topic context, its answer confidence, and its business significance alongside the map position before making strategic decisions.
The strongest use of the Compliance Map is in combination with the rest of Knowledge Orchestration: the ranking model identifies what matters most, the answer audit shows how well it is currently answered, and the Compliance Map helps suggest how it may need to be answered.
Cluster Map and Compliance Map compared
The two maps serve different but complementary purposes. The Cluster Map answers how the question space is distributed semantically — whether utterances and canonical questions are coherently grouped, where dense clusters exist, and where outliers appear. The Compliance Map answers how different questions should be handled operationally — which are low-risk and simple versus high-risk and complex, and what answer strategy may be most appropriate.
Together, they help you move from understanding what customers are asking, to how those questions relate structurally, to how those questions may need to be answered.