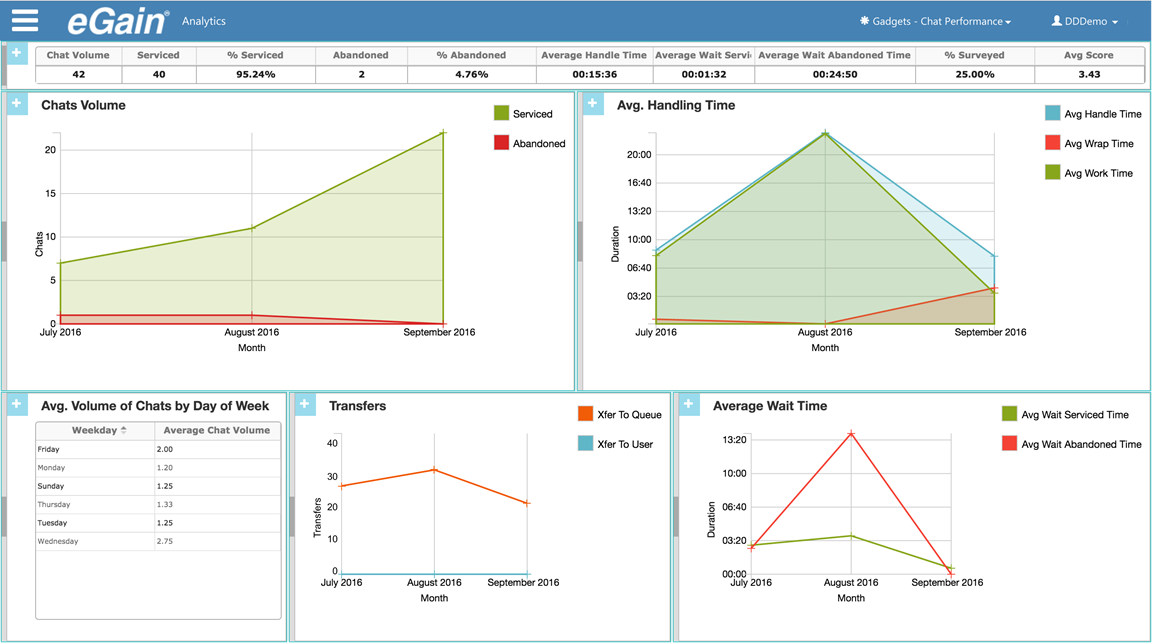
Chat Performance Dashboard
The Chat Performance dashboard enables you to analyze proactive and reactive chat volume and customer experience metrics including wait time, handle time and transfer trends over the last 3 months.
Reports in the Chat Performance dashboard are based on Chat Activity and Activity Routing report models.

The Chat Performance dashboard is based on Chat Activity and Activity Routing models filtered by the Chat Activity Type, and presents the following information:
- Chat Volume: The number of times that chats were serviced or abandoned. Includes incoming and transferred chats.
- Serviced: The number of times that chats were serviced. The assigned agent clicked to join the chat and the customer had not abandoned. Includes incoming and transferred chats.
- % Serviced: The proportion of chats that were serviced.
- Abandoned: The number of chats abandoned. The customer left while waiting for an agent to service the chat. Includes incoming and transferred chats.
- % Abandoned: The proportion of chats that were abandoned.
- Average Handle Time: For chats handled (completed by the agent or transferred out), the total time that the agent spent working on those chats.
- Average Wait Serviced Time: For all times that chats were serviced, the average time which elapsed from each chat being assigned to the queue (or transferred between agents) until the agent clicked to join.
- Average Wait Abandoned Time: The average wait time before a chat is abandoned.
- % Surveyed: The number of chat surveys submitted, expressed as a percentage of the number of chats completed.
- Average Score: The average survey score for chat surveys submitted during the interval. Each survey score is the sum of its question scores (for example, three 5-star ratings will produce a survey score of 15). Text based answers are ignored.
The following charts and reports are included in this dashboard.
|
Chart/Report |
Parameter |
Chart Type |
Description |
|---|---|---|---|
|
Chats Volume |
Queue |
Area |
The number of times that chats were serviced vs. abandoned. Shows the level at which customer demand for chat interaction is being met. |
|
Average Handling Time |
Queue |
Area |
For chats handled (completed by the agent or transferred out), the total time that the agent spent working on those chats, broken down into work time (with the customer present) and wrap time (after the customer has left). This is a measure of cost to serve. |
|
Avg. Chat volumes |
Queue |
Grid |
The average volume of chats received by day of the week. This report highlights which days of the week are peak periods for chat interactions. |
|
Transfers |
Queue |
Area |
The total number of chat activities that were transferred out to another agent, queue or department. Transfers can impact the customer experience and drive up the cost to handle the customer since more than one agent is required to resolve the inquiry. |
|
Average Wait Time |
Queue |
Line |
The average amount of time a customer waits after being assigned to a queue (or being transferred between agents) before an agent services the chat or before they abandon. High wait times can impact customer experience. |