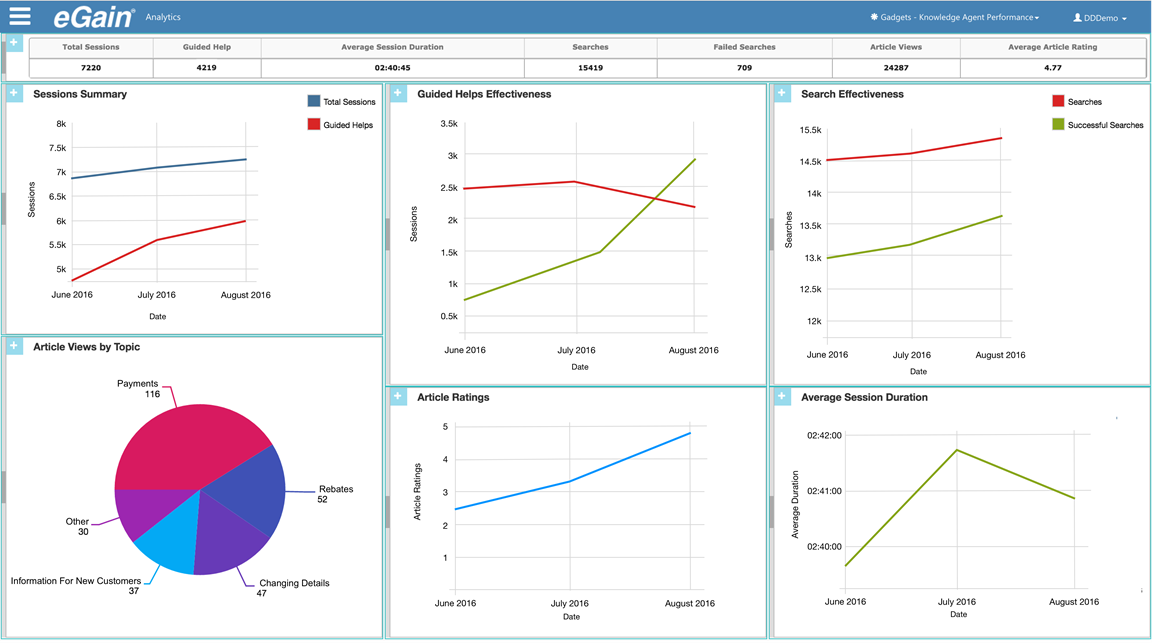
Knowledge Agent Performance Dashboard
The Knowledge Agent Performance dashboard provides an overview of knowledge usage by agents including guided help solution acceptance rates, search success, and article views by topic for the last 4 months.
The dashboard is based on reports build from the Self-service Performance and Self-Service Usage report models.

The following KPIs are presented at the top of the dashboard, aggregated for all Knowledge Portals that the user has permission to see across the 7-day period:
- Total Sessions: The number of Knowledge Agent sessions.
- Guided Help: The number of guided help sessions.
- Average Session Duration: The average duration of Knowledge Agent sessions.
- Searches: The number of searches during Knowledge Agent sessions.
- Failed Searches: The number of searches which returned zero results.
- Article Views: The number of articles accessed during Knowledge Agent sessions.
- Average Article Rating: The average rating for articles rated by agents.
The Knowledge Agent Performance dashboard contains the following charts and reports:
|
Chart/Report |
Parameter |
Chart Type |
Description |
|---|---|---|---|
|
Session Summary |
Portal |
Line |
The total volume of agent sessions and guided helps during the period. Shows the trend at which knowledge is being adopted by agents. |
|
Guided Help |
Portal |
Area |
The trends for the volume of agent guided help sessions and how many solutions are accepted by the agent. This is used to track that guided help sessions are providing relevant content to agents. |
|
Search Effectiveness |
Portal |
Area/Line? |
The number of searches, successful searches (returned an article) and searches that resulted in article view. This chart indicates how easily articles can be found by agents using search and can help identify content gaps. |
|
Article Views By Topic |
Portal |
Pie |
A pie chart showing the number of article views by topic. This chart gives an indication of which topics are being used most by agents over the period. This can provide a general insight into what is driving customer inquiries being handled by agents. |
|
Avg. Article Rating |
Portal |
Line |
The overall trend for article ratings for all portals that the agent can see over the last 3 months. A declining trend can indicate the newly introduced content has issues or that existing content has become out dated or inaccurate. |
|
Avg. Session Duration |
Portal |
Line |
The trend for the average duration for agent knowledge sessions. |