Omnichannel Dashboard
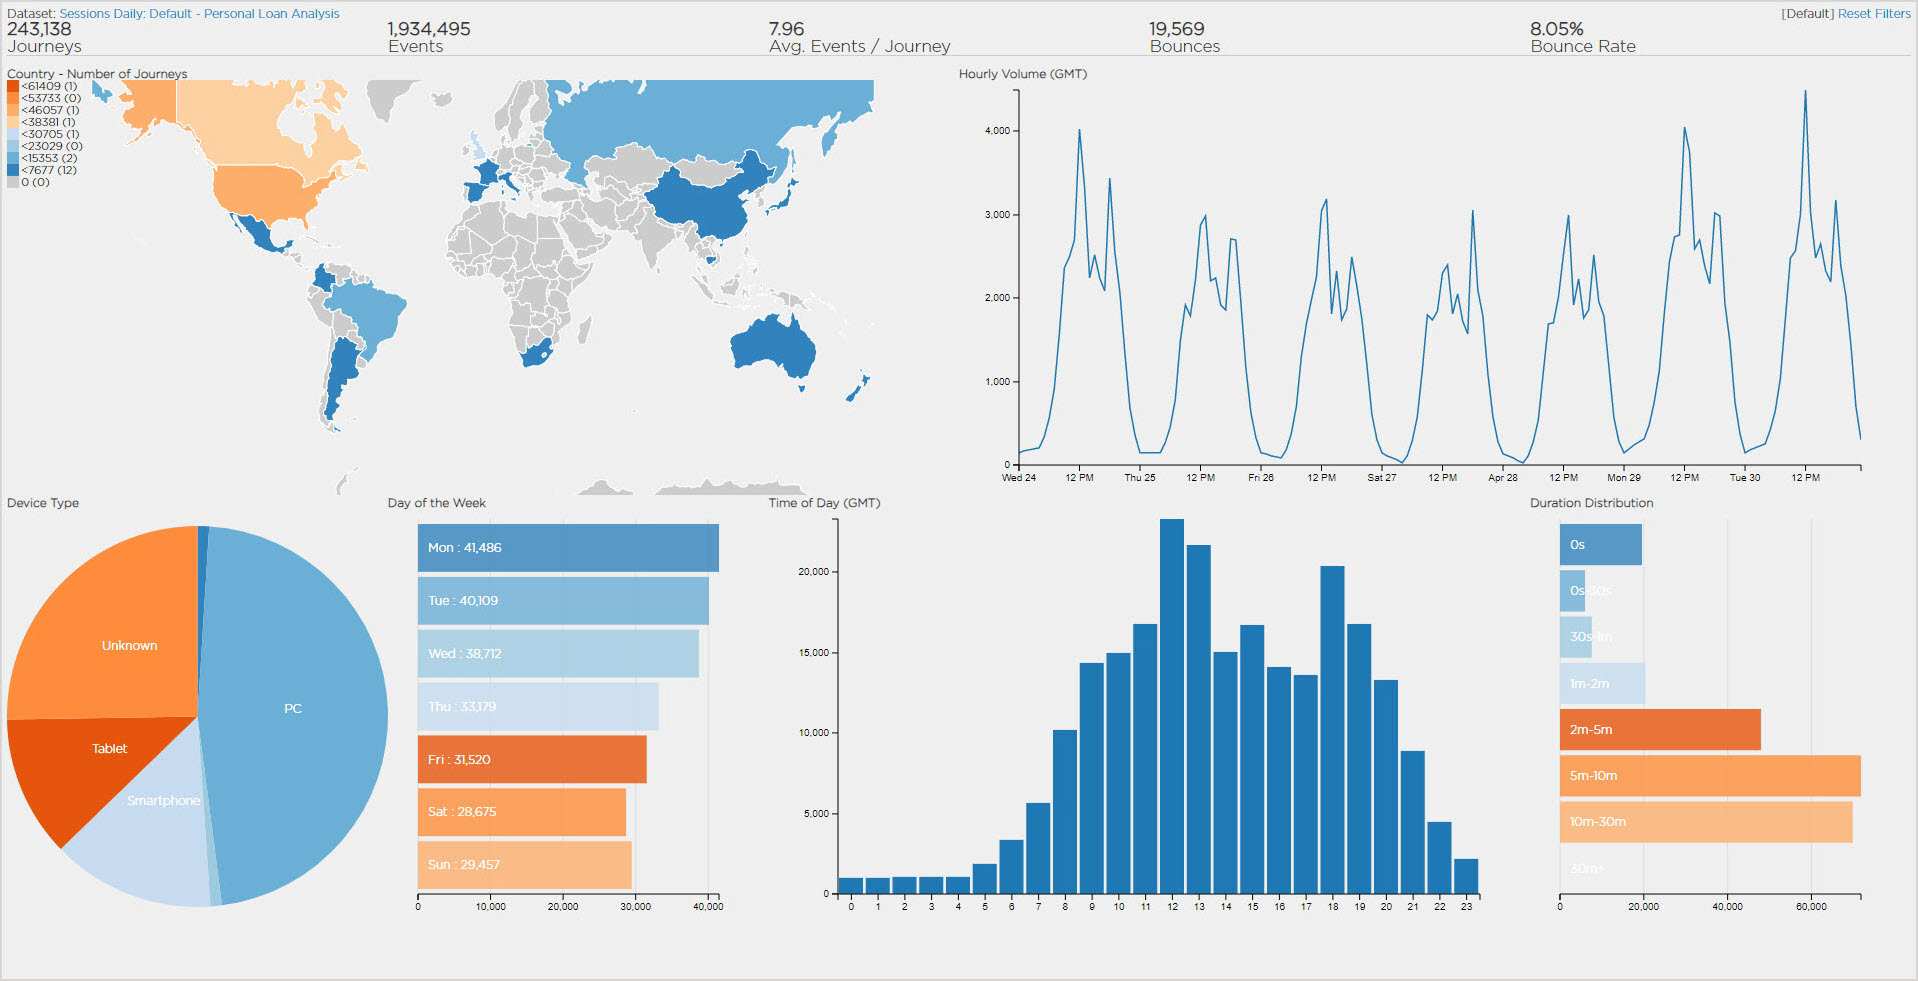
The Omnichannel dashboard gadget is an interactive view of the volume of activity and traffic to a site or IVR. It enables businesses to monitor overall traffic volumes and visitor trends.
The gadget presents the country that visitors to a site are coming from, the devices they are using to access a site, the peak days and hours of site or IVR use, any spikes in visitor volume per hour, and when visitors spend the longest time on a site or in an IVR.

The Omnichannel dashboard gadget presents the following information:
- Journeys: The number of visits to the website (in the case of web journeys) and calls within the IVR (in the case of IVR journeys).
- Events: Events are the individual steps which a journey consists of. For a web-based journey, these are page views or form submissions. For IVR-based journeys, these are the discrete steps or decision points within the IVR flow.
- Average Events / Journey: The average number of events (for example, page views or IVR steps) which each journey consisted of. This can be an indicator of customer effort.
- Bounces: The number of journeys where the customer did not proceed beyond the first event (for example, the landing page of the site or the 1st set of IVR options).
- Bounce Rate: The number of journeys where the customer did not proceed beyond the first event (for example, the landing page of the site or the 1st set of IVR options). This is expressed as a percentage of the total number of journeys.
You can refine analysis with interactive filtering on customer experience KPIs to explore how different factors impact other trends. This can show how the data varies by country, or the peak times of day for different days of the week. This allows businesses to identify when most traffic to a site or IVR takes place and therefore when most assistance may be necessary.
For example, you can filter by journeys started on a certain day, such as Tuesday. To do this, click on the bar for Tuesday within the Day of the Week bar chart. The gadget automatically reconfigures to show you the interactions for a Tuesday only. This enables you to track visitor trends such as the peak time of the day on a Tuesday. If the peak time is 12 PM, this shows that this is the time of day which may need the most assistance from the business.