Knowledge Orchestration Dashboard
The Knowledge Orchestration dashboard is the central workspace for monitoring job status, reviewing question coverage, and acting on knowledge gaps. It refreshes automatically after each job run and surfaces the most actionable information for knowledge managers and authors.
Pending Project Import
When a project is sent from eGain WYCA using See answers in eGain, a banner appears at the top of the dashboard with the project name and a Requires action indicator.
-
Select Import to open the Create Job - Import Project dialog for the project, and then create the job.
-
Select Cancel to discard the project.
For more information, see Importing a WYCA Project.
Job Status Bar
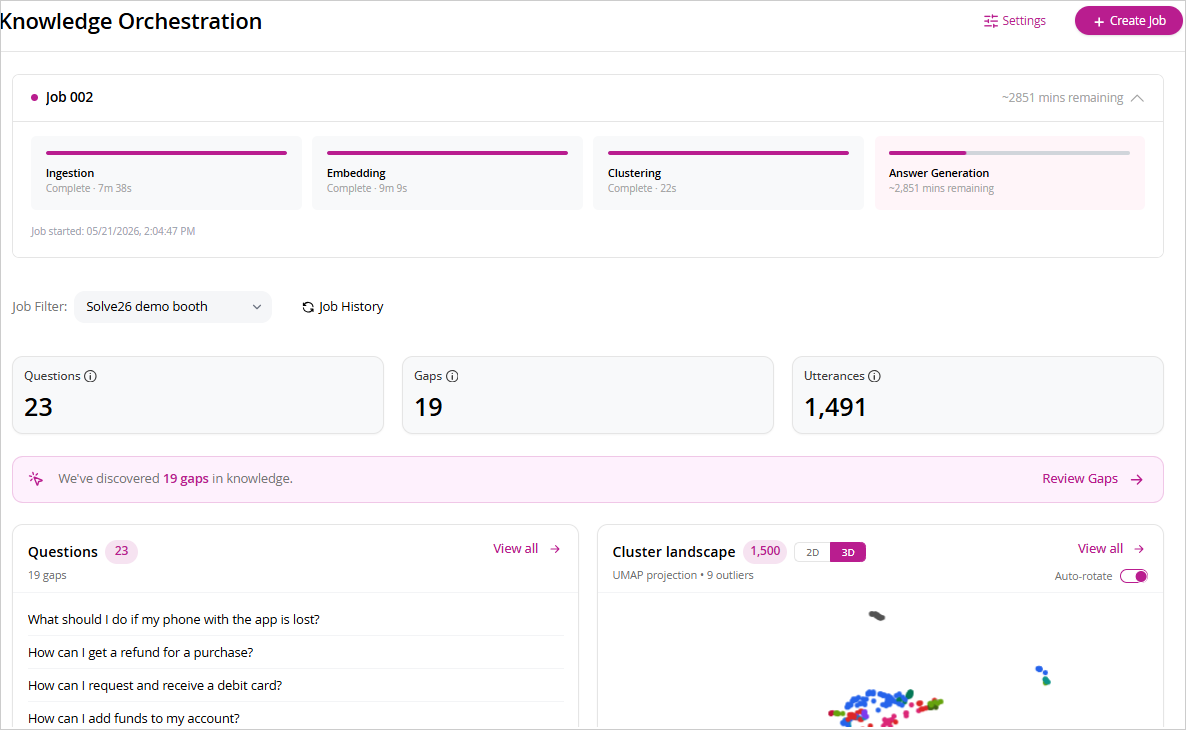
At the top of the dashboard, the active job panel displays the name of the most recently run job and its elapsed time. A five-stage pipeline tracker shows the progress of each processing phase: Ingestion, Embedding, Clustering, Topic Hierarchy, and Instant Answer Generation. Each stage shows either Complete, a percentage in progress, or a dash if it has not yet started. The job start date and time appear below the tracker.
Use the Job Filter dropdown to switch between all jobs or a specific job, and select Job History to review previously completed runs. The Last updated timestamp in the upper right of the filter bar indicates when the dashboard data was last refreshed.
Job History
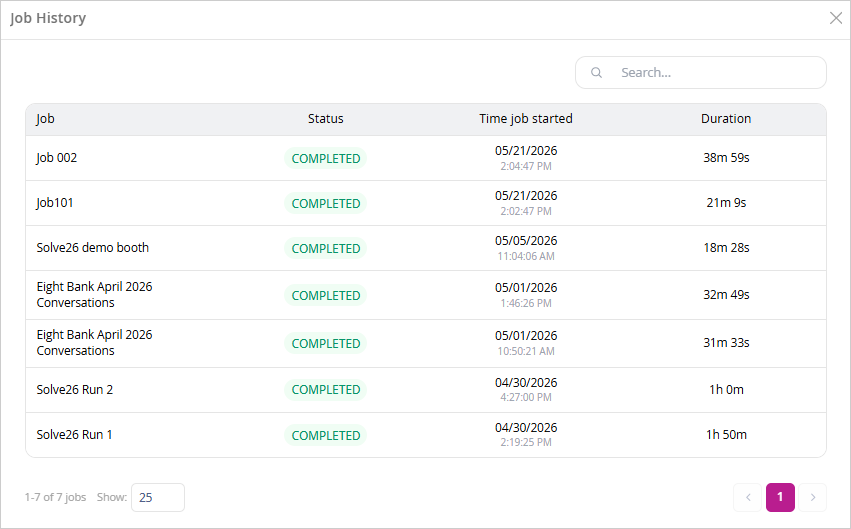
Select Job History in the filter bar to open the Job History modal, which lists all jobs that have been created in the workspace. The modal displays up to the number of jobs set in the Show control at the bottom of the list, with pagination available when the total count exceeds that limit. Use the Search field to locate a specific job by name.
Each row in the list shows the following:
-
Job: The name assigned to the job at creation.
-
Status: The current state of the job. The possible statuses are:
-
Completed: The job finished successfully and its results are available on the dashboard.
-
Running: The job is currently in progress. Duration shows as In progress.
-
Pending: The job is queued and has not yet started. Duration is not shown.
-
Failed: The job did not complete successfully. Review the job configuration or data source and resubmit if needed.
-
-
Time job started: The date the job was initiated.
-
Duration: The total time the job took to complete. Pending jobs show a dash; running jobs show In progress.
Failed jobs retain their duration data where processing had begun before failure. A very short duration on a failed job (for example, 8 seconds) typically indicates an early-stage error such as a data ingestion or configuration issue.
Summary Metrics
Use the Job Filter dropdown to switch between all jobs or specific jobs.
Three metric tiles provide a high-level snapshot of the current data set for the selected job:
-
Questions: The total number of canonical questions identified across all clusters.
-
Gaps: The number of questions where the portal returned no answer or a confidence score below the configured threshold.
-
Utterances: The total number of raw questions and queries extracted from transcripts and search logs before clustering. A high utterance-to-question ratio indicates that many customer questions map to the same underlying intent.
Gap alert banner
When gaps are detected, a banner appears below the metric tiles indicating the total number of gaps discovered. Select Review Gaps to navigate directly to the filtered gap questions.
Questions
The Questions panel lists canonical questions ranked by priority score. Each question represents the best single phrasing for a cluster of semantically equivalent utterances. Questions tagged New have been observed for the first time in the current job run and have no prior history in the workspace; knowledge managers should triage these to determine whether they warrant immediate attention.
Select View all to open the full question list with filtering and sorting options. For more information, see Reviewing Canonical Questions.
Cluster landscape
The Cluster landscape panel displays a UMAP projection of all question clusters, rendered as a scatter plot. Each point represents a question; color groupings indicate cluster membership. The visualization provides a spatial overview of how questions relate to one another — tightly packed groups share similar intent, while outliers may indicate niche or emerging topics.
The panel header shows the total number of utterances plotted, the number of clusters, and a toggle for two-dimensional or three-dimensional rendering. Select View all to explore the full interactive cluster map. For more information, see Visualizing the Question Landscape.
Star Questions
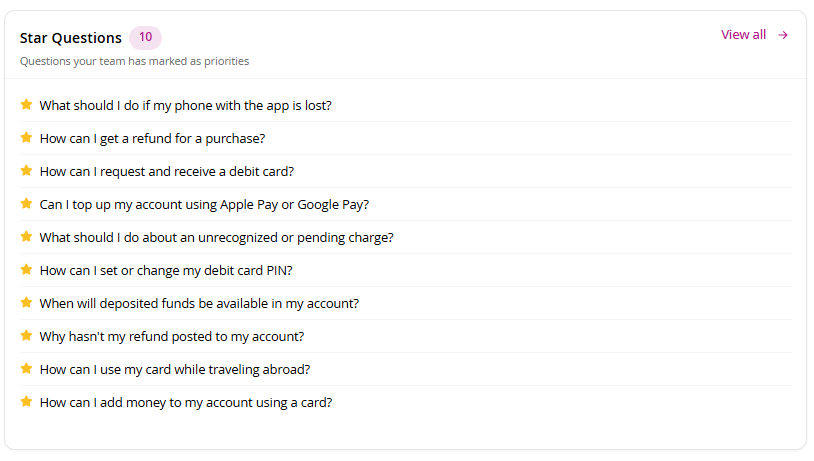
The Star Questions panel shows questions that the knowledge manager's team has explicitly marked as priorities. These are the items authors should work on first. The count badge in the panel header shows how many starred questions are currently active. Select View all to manage the full starred list.
Topics
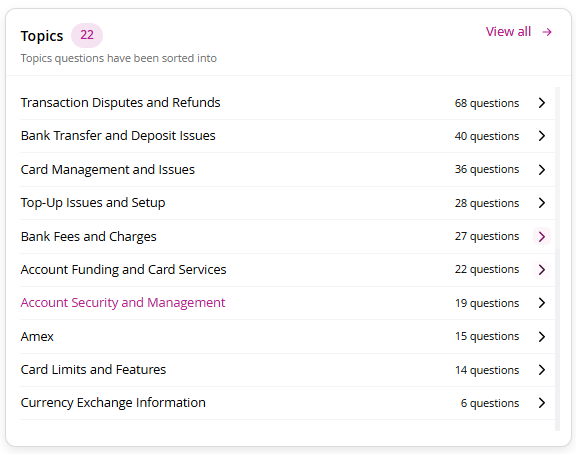
The Topics panel shows the auto-generated topic categories into which canonical questions have been sorted. Each topic displays the number of questions it contains. Topics are inferred from clustered question content and organized into a hierarchy of topic and subtopic levels. Select a topic row to drill into its questions, or select View all to see the complete topic hierarchy.
Topic and Intent views
Selecting View all from the Topics panel opens the full taxonomy view, which offers two distinct, navigable perspectives on the same canonical questions. Switch between them using the Topic and Intent tabs at the top of the list:
-
Topic: Organizes canonical questions under a hierarchy that reuses your portal and department's existing topics wherever a question matches one. Where no existing topic matches, Knowledge Orchestration suggests a new topic with an appropriate label. Topics tagged New contain questions that appeared for the first time in the most recent job run.
-
Intent: Organizes canonical questions under a purely system-generated intent and sub-intent hierarchy, independent of your portal or department's existing topic structure. Use this view to see how Knowledge Orchestration would naturally group questions by intent, without being constrained by your current taxonomy.
Both views are generated with every taxonomy run, so you can compare how a question is classified against your existing topics versus how it would be classified purely by intent.
In either view, use the filter chips (New Questions, Star, Flagged For Revision) and the Search questions field to narrow the list, and select Download to export the current view.
The list displays the following columns for each entry, in both the Topic and Intent views:
-
# of Subtopics — The number of subtopic (or sub-intent) levels nested under the topic or intent.
-
# of Questions — The total number of canonical questions sorted into the topic or subtopic (or intent or sub-intent).
-
Volume — The combined utterance count across all questions in the topic or intent, reflecting how frequently that subject area appeared in source data.
-
Value — The aggregated business importance score for questions in the topic or intent, where assigned.
Navigating the hierarchy
Topics and intents are organized in a parent-child structure. Select the expand arrow next to a topic or intent to reveal its subtopics or sub-intents. These can be expanded further to reach individual canonical questions. This allows you to navigate from a broad subject area down to specific questions without leaving the current view. Selecting a question opens the Question Details pane.
Volume and Value scores at the topic or intent level reflect the aggregate of all questions within that topic or intent. A dash in the Value column indicates that no value score has been assigned to questions in that topic or intent yet.
Related Topics